

There’s a conversation we’ve had with sellers more times than we can count. It usually starts the same way:
“I had no idea my refund rate was that high.”
“Why didn’t I see the disputes building up?”
“How was I supposed to know my marketplace visibility was at risk?”
The honest answer?
Until now, you really couldn’t.
You had pieces of the picture. Not the full dashboard view. We did. That information gap wasn’t good for sellers, affiliates, customers, or the marketplace overall.
Today, we’re closing that gap.
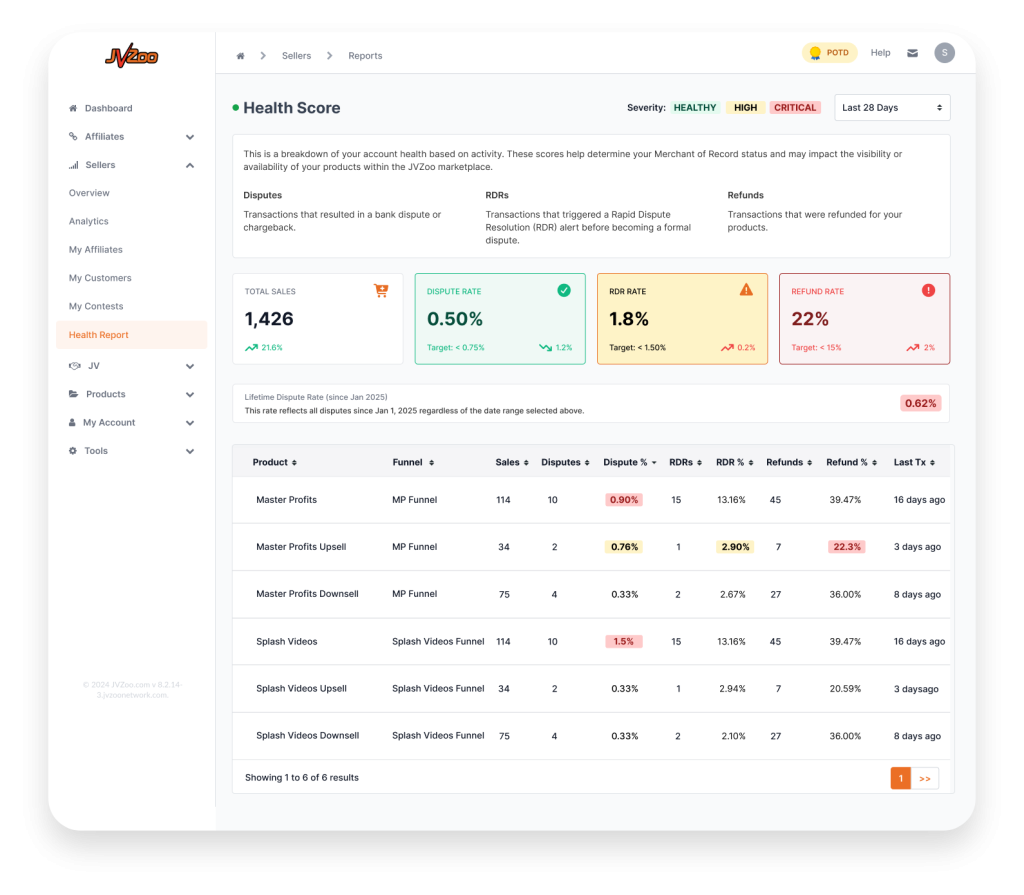
The new Seller Health Dashboard is now live in every JVZoo seller account. It gives you real-time visibility into the exact metrics used to evaluate your account standing (disputes, RDRs, and refunds), broken down by product and scored against published targets.
You’ll find it at Sellers → Reports → Health Report in the left sidebar.
Why this matters more than it might look
Three numbers determine how JVZoo treats your seller account:
- Dispute rate: how often your transactions end in a bank dispute or chargeback. Disputes happen when a customer goes straight to their bank instead of contacting you. Usually because they don’t recognize the charge, believe the product wasn’t delivered, feel it didn’t meet expectations, or suspect fraud. Banks and payment processors take dispute rates seriously, and so do we.
- RDR rate: how often a Rapid Dispute Resolution (RDR) alert is triggered before a dispute becomes formal. In many cases the RDR system auto-refunds the transaction to head off a formal bank dispute. RDRs are less severe than disputes but high RDR activity is still a signal that something on the customer-satisfaction side needs attention.
- Refund rate: how often your transactions are refunded. Some refunds are normal. Unusually high refund rates usually mean a mismatch between what your sales page promises and what the product delivers.
These aren’t just metrics for fun. They directly determine your JVZoo Processing Services status and the visibility and availability of your products in the JVZoo marketplace. If those rates creep into the danger zone, your reach shrinks without you being told about it, and historically you’d find out only after the damage was done.
The Seller Health Dashboard is an early-warning system designed to help you spot issues before they become account-level problems.
What you see when you open it
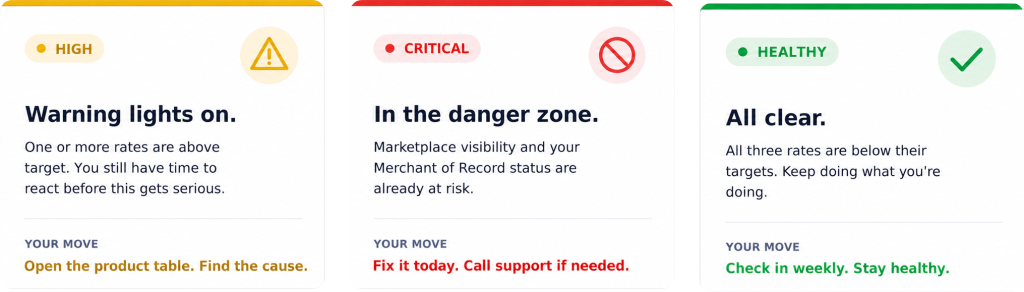
A severity badge at the very top. HEALTHY (green), HIGH (yellow), or CRITICAL (red). In three seconds, you’ll know whether your account is stable, trending in the wrong direction, or already at risk.
Three KPI cards, each scored against a published target:
- Dispute Rate, target < 0.75%. Below it, you’re clean. Above, you get a yellow flag. Well above, red.
- RDR Rate, target < 1.50%. RDR alerts are disputes intercepted before they became formal. High RDR activity is an early signal that disputes are coming.
- Refund Rate, target < 15%. High refunds usually mean a mismatch between what your sales page promises and what the product delivers.
A Lifetime Dispute Rate that reflects all disputes recorded on your account since the start of the current year, regardless of the date filter. This is your long-view metric. Useful for spotting the overall trajectory of your account beyond short-term fluctuations.
A product-level breakdown table. This is the part you’ll spend the most time in. Every product and funnel you sell shows up as a row with:
- Sales count
- Disputes count + dispute %
- RDRs count + RDR %
- Refunds count + refund %
- Date of last transaction
If your overall account looks healthy, this table helps identify which products are generating the most friction.
If your overall account health is declining, this table shows you exactly which products are responsible, so you can investigate, improve, pause, or remove them instead of guessing.
One problematic product can drag down an otherwise healthy account without you noticing. Now you can see it happening before it spreads.
Built-in alerts and recommendations. If your account enters a HIGH or CRITICAL status, the dashboard surfaces a notification above the page with concrete recommendations. The full official list of suggested improvement steps:
- Review product quality and customer expectations
- Improve customer support response times
- Update sales copy or offer messaging
- Investigate products with unusually high dispute or refund activity
It’s important to act quickly once rates start increasing.

How to actually use this
A few suggestions from people who’ve spent a lot of time looking at seller health data:
- Check it weekly. Not daily. Daily creates noise. Pick a day (Monday morning is popular) and spend five minutes reviewing your numbers. The snapshot matters less than noticing when something starts trending the wrong way.
- Treat “HIGH” as your stop sign, not “CRITICAL.” Critical means visibility and availability are already at risk. High means you still have time to react. The whole point of the dashboard is that you can fix things while they’re still fixable. Don’t wait for red.
- When something’s off, go to the product table first. Most account-wide health problems are actually one or two product problems averaged across the account. The product table makes that immediately visible. Fix the one product, and the account-level numbers usually follow.
- Watch the trend, not just the number. A 0.7% dispute rate may be acceptable today. But if that same rate was 0.3% a month ago and 0.5% two weeks ago, you’re looking at a problem that’s actively growing, even if the dashboard still says HEALTHY. The number tells you where you are. The trend tells you where you’re heading.
- If a product can’t be fixed, retire it. Some products attract chargebacks no matter what you do. Usually because the offer over-promises, the price feels wrong, or the customer experience after the sale isn’t what was expected. If you can’t fix the cause, removing the product from sale is a legitimate move. Better to lose one product than your whole seller standing.
Where to find it
Log into JVZoo → in the left sidebar, expand Sellers → click Reports → click Health Report.
The date filter in the top-right defaults to Last 28 Days. Change it to Last 7 Days, Last 90 Days, or a custom range to look at different windows. The Lifetime Dispute Rate number doesn’t change when you change the filter. It’s always year-to-date.
Want the full feature walkthrough?
We have an official KB article that covers every section of the dashboard in detail, including the exact targets, what counts as a dispute vs. an RDR, and the alerts/recommendations system:
👉 Seller Health Dashboard: Official KB Article
Need help reading your numbers?
If you open the dashboard and you’re not sure what you’re looking at, or you’re looking at red and not sure what to do about it, the support team is at JVZoosupport.com. They’ve helped a lot of sellers work through this exact conversation.
One last thing
This dashboard exists because we want sellers to win. High dispute, RDR, and refund rates hurt everyone involved:
- Customers who receive disappointing experiences
- Sellers whose visibility declines
- Affiliates promoting affected offers
- The overall marketplace ecosystem
Catching issues early benefits everyone.
Go take a look at yours. Even if everything’s green, five minutes inside the Seller Health Dashboard is the best five minutes you’ll spend on your business this week.
👉 Sellers → Reports → Health Report
The JVZoo Team
