

The Sales Data
Everyone Ignores
What 28 Days of Transactions Actually Reveal
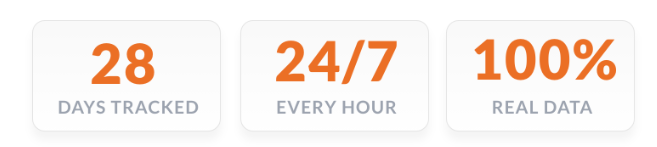
We tracked every transaction on JVZoo for the first 28 days of 2026.
Every hour. Every day. Every price point.
Here’s what the data actually shows.
You decide what to do with it.
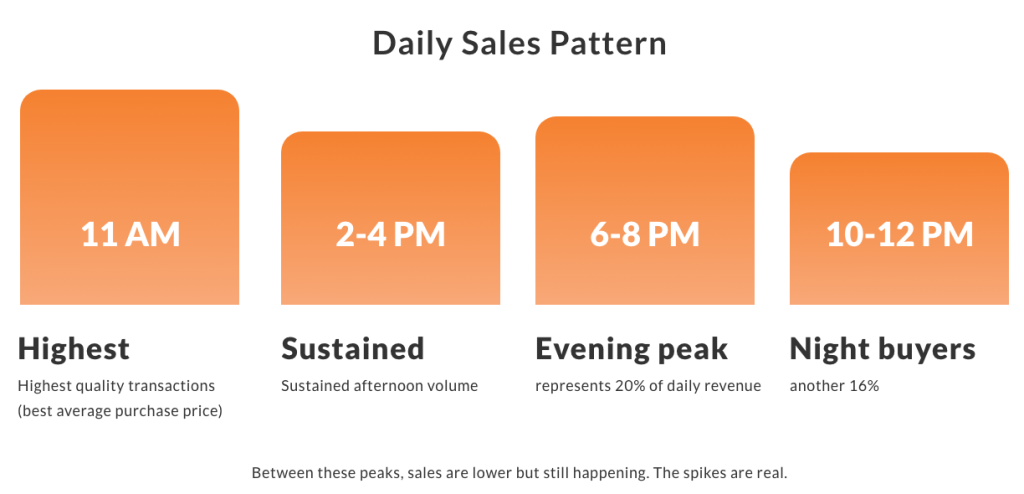
When Your Customers Buy (The Actual Hours)
There are peaks and valleys throughout the day. They’re consistent.
Why does this matter?
If you’re running campaigns during peak hours, you’re hitting a hot market. If you’re running during valleys, you’re fighting uphill.
You can use this however makes sense for your business.
Day of Week Pattern
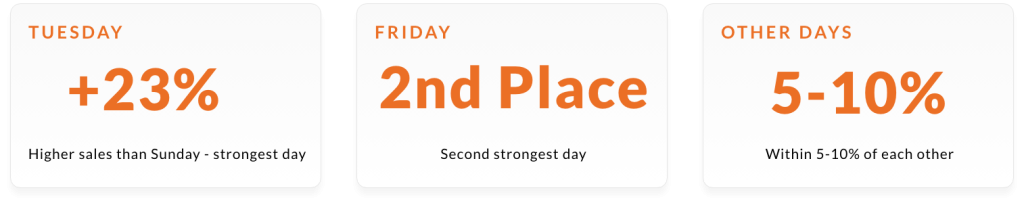
So Tuesday is the strongest market if you’re ready. But here’s what matters: Tuesday is the best to release day IF you’ve already tested and optimized your sales page.
If you haven’t tested yet, don’t wait for Tuesday to test. Release any day. Get data. Optimize. Then when you’re confident, hit Tuesday with a proven offer.
The old model of “release Tuesday and tweak for 48 hours” doesn’t work anymore. People have seen sales pages for decades. They know when something’s been hastily put together.
What this tells you:
Tuesday amplifies what’s already working. But you need something working first. Test it, optimize it, then release into the hot market.
Price Points & Revenue
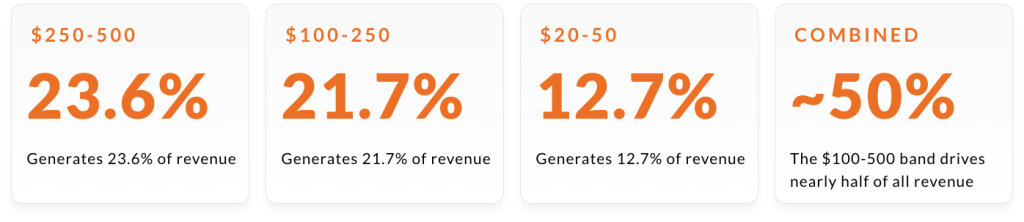
More interesting:
A customer who enters at $250-500 is worth 8.9x more lifetime value than someone who enters at $0-20.
What this tells you
If you’re thinking about testing price points, going higher creates dramatically different customer quality. Not just revenue per transaction—total customer value.
But here’s the critical part: Your product needs to be worth the price. Don’t raise prices just because higher price points bring more valuable customers. If your $29 product isn’t good enough to be a $129 product, raising the price won’t help. You’ll just get refunds. Test it first. Build a product good enough for the higher price. Get the data. Optimize. Then launch the proven price point when the market is hot.
Funnel Depth Matters
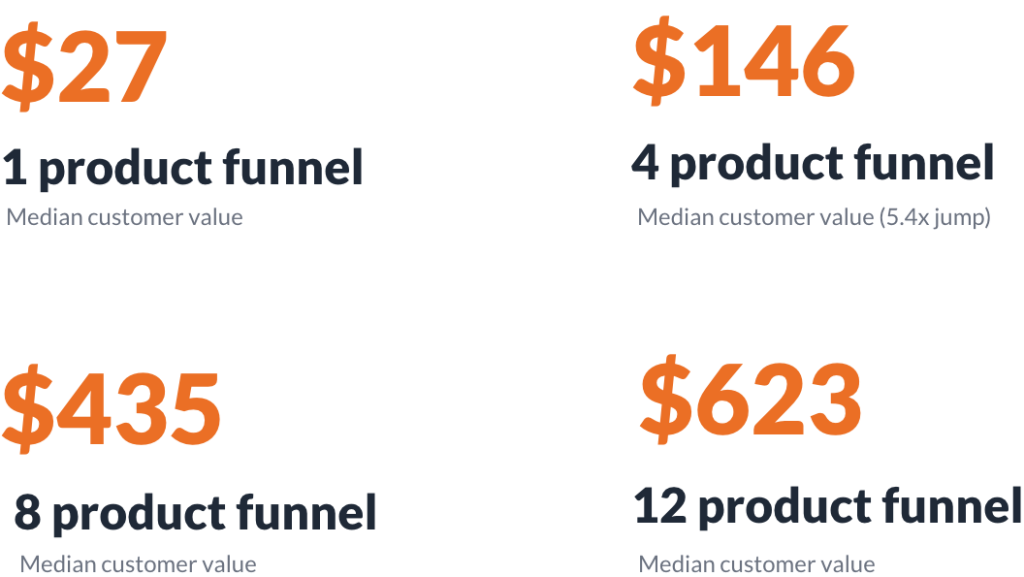
The jump from 1→4 is massive. Then it scales more gradually.
Here’s what’s actually happening in the top performers: The “12-item funnels” aren’t linear sequences. They’re split journeys.
Example structure:
- Standard path (4 items): $12 → $27 → $47 → $97 (most customers)
- Premium path (separate journey): $2,000 webinar → Phone room upsells (select customers)
Same funnel ID, two-part customer journey. Their initial experience gets them in, introduced to the vendor, who then puts the action takers down the higher ticket funnel, but with the same funnel id the original affiliate who drove the initial sale gets credited all the way through.
The insight
Don’t build a linear 12-item funnel hoping everyone goes through it. Build a tight 4-item path, then create branching logic that segments customers into either:
- Another 4-item value stack, OR
- A high-ticket path (webinar + premium offers)
This is why 12-item “funnels” work—they’re not actually 12 sequential items for the same customer. They’re strategic splits that capture different customer types.
The Day & Time Intersection
Here’s what’s actually happening: Most products on the platform release around 10 AM (webinars start, announcements go out, emails hit inboxes). By 11 AM, people have seen the offer and are ready to buy.
That’s why 11 AM is the consistent peak.
Tuesday 11 AM is the strongest (23% higher than Sunday). That makes sense—the platform has the most releases and activity on Tuesdays.
But here’s the real insight: 11 AM is the strongest buying hour on Wednesday, Thursday, Saturday, and Sunday too. Not as much volume as Tuesday, but the pattern is identical.
Why? Because whenever products release at 10 AM, buying spikes at 11 AM. The pattern is consistent across the entire week.
For sellers:
Don’t just follow “Release Tuesday.” Focus on the 11 AM window. If your audience data shows you’re strongest on Friday, then Friday 11 AM is your golden hour. If Wednesday works better for your niche, Wednesday 11 AM is where you’ll see the spike.
The day matters (Tuesday is objectively stronger). But 11 AM is the universal buying window.
Refund Rate Reality
Overall: 6.72% refund rate (healthy, industry standard is 5-7%)
By Category:
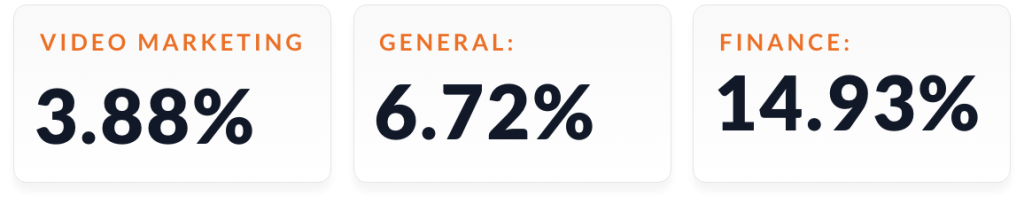
Finance products have 2.2x higher refund rate. Either those products have quality issues, or expectations are mismatched.
What this tells you
High refunds signal misalignment — either quality or expectations are off.
What You Can Actually Do With This
If you want to test timing: You know where the peaks are. Email into them or not. Run ads then or at other times. Test it against your own data.
If you’re pricing: You know $100-500 entry points generate 8.9x customer value vs budget entry. You can test higher pricing.
If you’re funnel building: You know 4-item funnels hit a sweet spot. You can build there first, then extend if it works.
If you’re choosing products: You know what’s selling by volume and revenue. High volume products feed funnels. High revenue products are the premium play.
If you’re picking a release day: Tuesday is objectively stronger. Or you can release on your audience’s best day.
The Real Takeaway
Sales aren’t random. They follow patterns.
Your specific audience might have different patterns. But these patterns show what’s possible.
Use them to inform your decisions. Test against your own data.
Don’t guess. Look at actual data and decide.