
When Your Customers Buy (The Actual Hours)
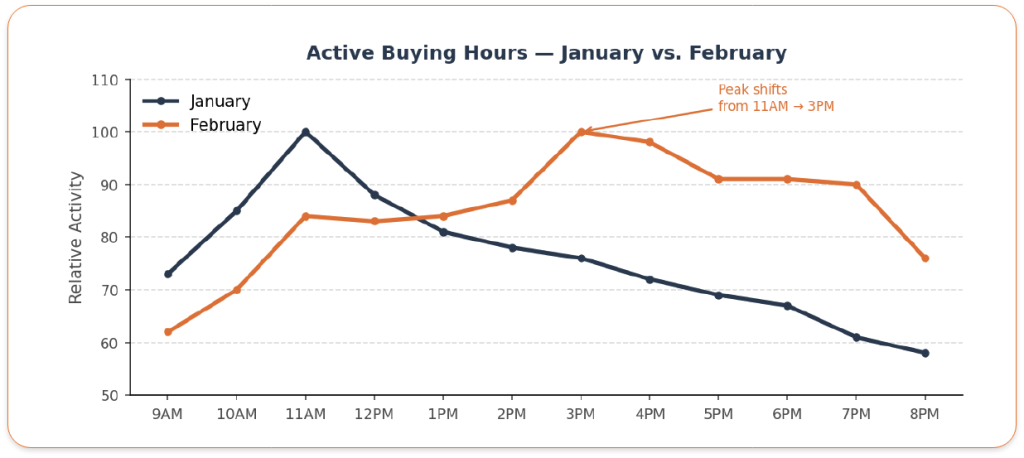
There are peaks and valleys throughout the day. They’re consistent. The midnight hour shows the single highest transaction count — but that’s almost entirely automatic subscription renewals. Those happen whether you do anything or not.
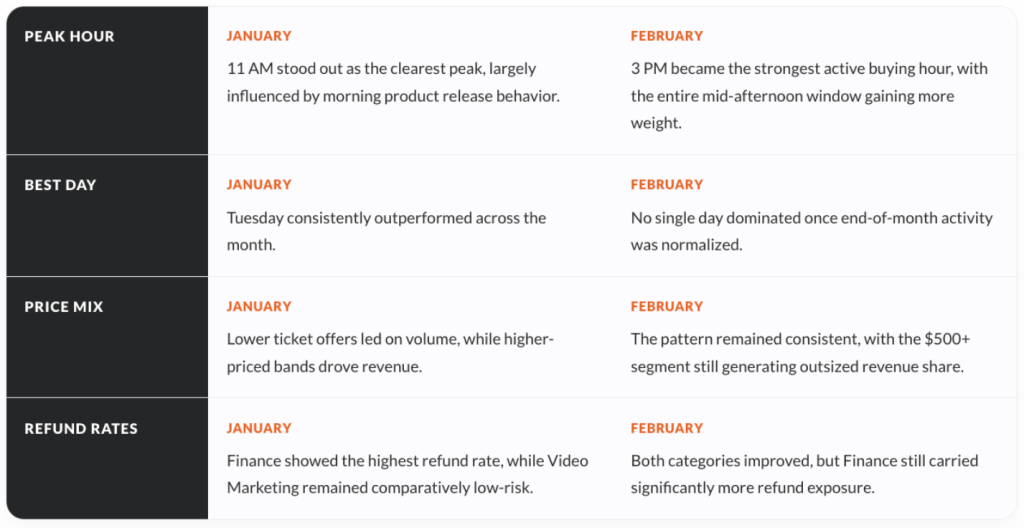
The active buying hours — real humans making decisions — cluster in the afternoon. The 2–7 PM block is where the bulk of purchase decisions happen in February. In January, 11 AM was the clear peak. In February, 3 PM took over and the afternoon block broadened.
Day of Week Pattern
When you look at February week by week rather than as a monthly total, the picture is more consistent than headline numbers suggest. For most of the month, volume was evenly spread across the week with no single day pulling ahead.
Mid-week days held steady throughout. Tuesday — January’s clear leader — performed consistently but without the same edge it had last month. The final two days of the month saw a significant concentration of activity that pulled those days’ totals well above everything else.
Remove that end-of-month spike and the week looks remarkably flat — buyers were active every day in roughly equal measure. February didn’t have a dominant day the way January did. Consistent presence across the week matters more this month than picking the perfect launch day.
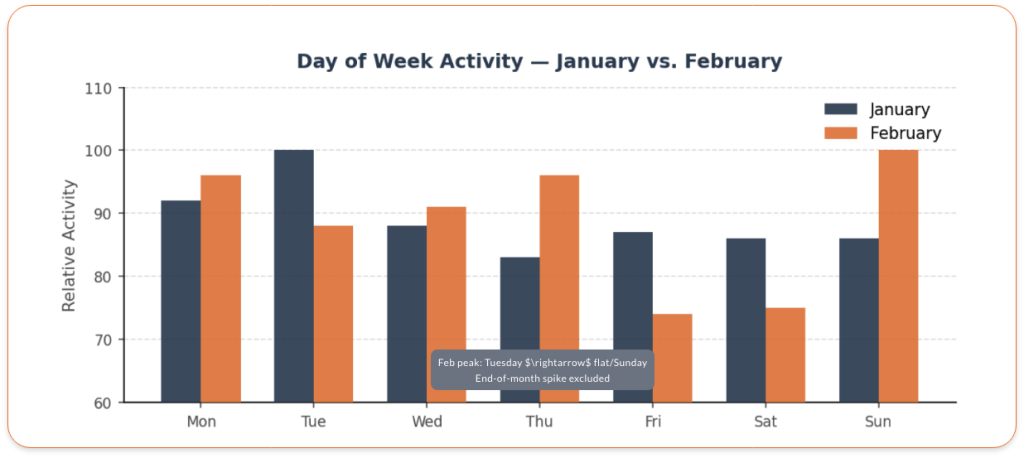 February excludes end-of-month spike. Each month indexed independently.
Price Points
Looking at new orders only — stripping out automatic renewals — the price distribution tells a clear story about where buyers are actually making decisions.
The under-$20 range accounts for nearly half of all new order transactions. But it represents only 11.5% of new order revenue. The $500+ range is the mirror image: just 1% of transactions, over 20% of revenue.
The $50–$100 band is the sweet spot — strong on both volume and revenue. Above that, transaction counts drop sharply but revenue share stays high. Volume and revenue follow completely different curves.
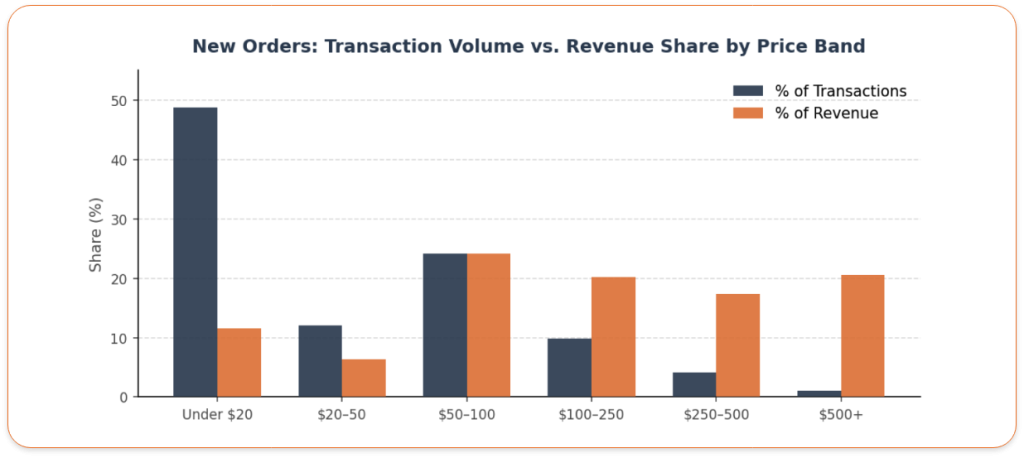 Automatic renewals excluded. New orders only.
Top Products: Volume vs Revenue
The products moving the most units aren’t the same ones driving the most revenue. These are two different strategies.
Volume leaders tend to be lower-priced, recurring, or evergreen products. Lots of transactions, accessible price points. Revenue leaders are high-ticket products with far fewer transactions — premium price, smaller audience, higher value per customer.
Both approaches are working on the platform. They’re just building very different businesses.
Refund Rate Reality
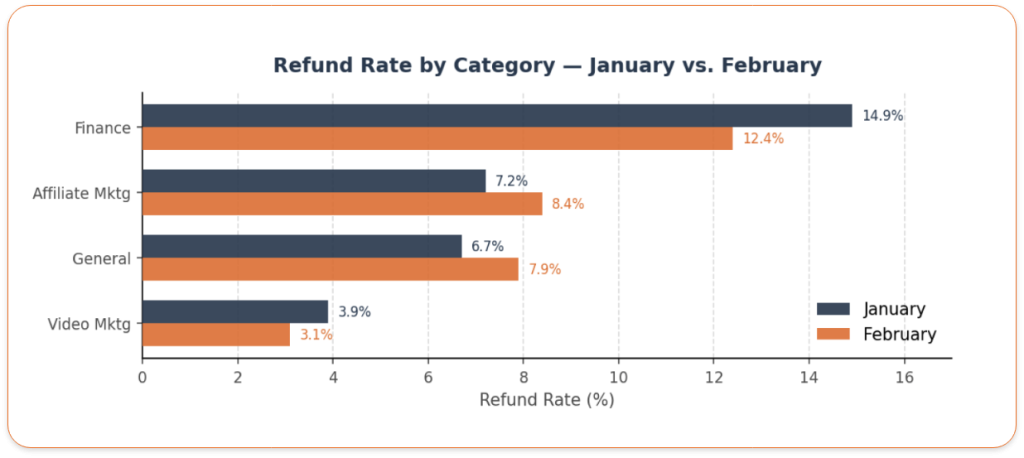
Overall platform refund rate: 8.3%
Finance improved from January but remains the highest-risk category by a wide margin — nearly 4x the refund rate of Video Marketing. High refunds signal one of two things: quality issues or expectation mismatches. Both are fixable.
January vs. February: What the Data Shows
Two months in, and some patterns are holding while others are shifting.
The Real Takeaway
Sales aren’t random. They follow patterns.
February’s patterns are different from January’s in some important ways. Your specific audience might follow neither. But the data shows what’s happening at scale across the platform.
Use it to inform your decisions. Test against your own data. Don’t guess. Look at actual data and decide.